Articles
Advanced compressor control and monitoring systems
Special Focus: Maintenance and Reliability
K. BRUN and T. OMATICK, Elliott Group, Jeanette, Pennsylvania; and J. JACOBY, Tri-Sen Turbomachinery Controls, Webster, Texas
Modern advanced control and monitoring systems for centrifugal compressors support compression plant operation at the highest possible efficiency, availability and reliability. From an operational perspective, the basic function of a compressor control system is to provide startup and shutdown sequencing, operational and process control, human-machine interfacing and monitoring, and equipment safety alarms and shutdowns. More simply, the controller provides machine control, protection and monitoring capabilities. Even older and most basic compressor controls offer this set of minimal functionalities, albeit they may be slow and their operator interfaces are not user friendly.
Modern centrifugal compressor controls. Centrifugal compressor control systems have been in use since the original development of centrifugal compressors more than 100 yr ago. Original control systems were mechanical or electromechanical systems that provided startup, shutdown and sometimes basic speed control for DC motor and steam turbine-driven compressors. Surge control systems were added in the late 1930s once the surge phenomenon and the surge line on the compressor operating map were better understood. In the 1960s, control systems using relay controls were introduced that provided not just operating and surge control, but also more advanced process control, operational sequencing and basic temperature, pressure, flow and vibration monitoring. With the digital revolution, these systems were improved to include sophisticated human-machine interfaces (HMIs), historical trending, full process control, and many other control and diagnostic features.
Modern control systems come with advanced load sharing and process control algorithms that can significantly enhance machinery and plant performance. For example, an advanced surge control system can significantly improve a compressor station’s efficiency since it avoids unnecessary or excessive recycling by more accurately predicting the surge limit, and by ensuring that the compressor performance controller does not adversely interact with the anti-surge controller. Optimized load sharing between multiple units in a compressor station has been demonstrated to increase station efficiency by several percentage points. Similarly, historical trend monitoring, advanced vibration diagnostics and digital performance twins allow operators to make intelligent decisions on maintenance and repair requirements to minimize the downtime of a compressor.
Aside from basic control and monitoring functionalities, most operators expect the following features from a modern control system:
- Trend monitoring of all critical process and mechanical process variables to allow for condition/risk-based maintenance rather than simple schedule-based maintenance. This is an important tool to identify and improve predictions of operational, maintenance or failure trends.
- Physics-based digital performance twins to determine the level of machine degradation and off-design behavior. This helps to identify when the machine’s performance has degraded to the point where interference is necessary, and also serves as a valuable diagnostic tool for early failure identification.
- Remote monitoring and diagnostics capabilities so that operator teams located around the world can jointly but remotely evaluate a machine’s operational characteristics and potential failure modes.
- Advanced vibration diagnostic tools that go beyond simple synchronous vibration amplitudes. Full vibration spectrum analysis, waterfall plots, orbit plots and Bode plots are critical tools to validate a compressor’s mechanical performance.
- Advanced surge control systems with non-linear surge lines, monitoring of rate changes, and predictive surge valve control can significantly decrease the risk of surge-based compressor failures, while extending the operating range of the compressor.
- Process control and load-sharing optimization to integrate with plant control systems for efficient and reliable system control beyond just the compressor.
Compressor performance monitoring system (CPMS)a. In response to these market demands, the authors’ companies have jointly developed a new CPMS, a "compressor-focused" suite of software and enabling hardware that augments a compression plant's predictive/proactive maintenance strategy. It can be customized for a specific application, but generally includes a focus-designed compressor performance comparison and evaluation, advanced vibration analysis tools, and remote compressor and auxiliaries controls monitoring (RCM).
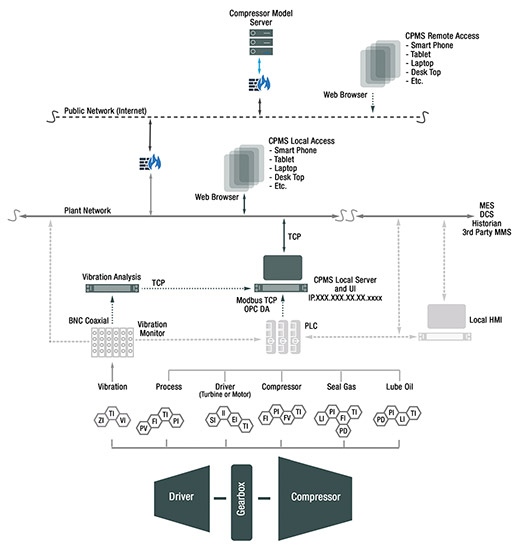
The new CPMS collects high-resolution compressor data by connecting to the compressor control’s programmable logic controller (PLC) and the compressor vibration monitoring system. This data is then stored in an integrated "micro-historian" database, accessed by the CPMS application softwarea, and presented in contextually relevant, easy-to-understand graphics. Features of the system provide an intuitive "website"-like interface (no "client" software required apart from an internet browser), a machine-specific custom compressor model (digital twin), compressor performance evaluation, a process interface model, a vibration analysis interface, an integrated system dashboard, a remote controls monitor, configurable alarming with push notification, and a single integrated database [with a configurable update rate between 500 msec (milli-seconds) and 5 min]. System security is ensured by a modbus transmission control protocol (TCP) communications interface, an OPC DA interface, IEC-62443 cybersecurity certification, two-factor user-credential-authentication to prevent unauthorized access, and multi-level password protection/access (admin, engineer, user, etc.). FIG. 1 shows a functional schematic of the new CPMS.
Compressor digital twin application. The compressor digital twin application provides a contextual and graphical representation of the deviation (and change in deviation) in the compressor’s “predicted” to “actual” performance for any given set of process conditions, using real-time or historical data. It is based on the authors’ company’s custom compressor model that performs a near real-time performance evaluation and comparison with a physical digital twin. The application-specific custom process interface model provides an integrated system dashboard with configurable alarming and "push notification" capability.
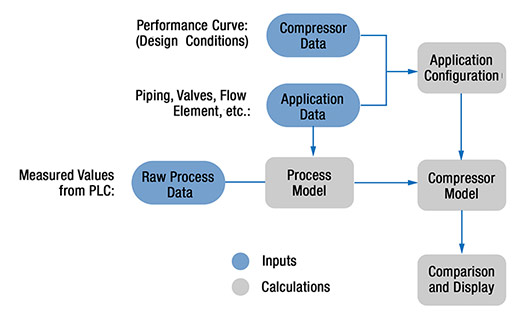
The compressor digital twin application evaluates the compressor performance by first calculating "predicted" compressor outputs for current process conditions, and then uses the company’s compressor performance maps, instrumented and modeled process data, application data and a custom compressor model (specific for the compressor and application) for comparison and demarcation of deviations. The predicted performance value is compared and evaluated against the actual compressor performance. Deviations in actual compressor performance vs. predicted compressor performance are represented graphically. If push notification is enabled and a change in deviation exceeds a configurable threshold, an SMS or email notification is sent to the appropriate plant personnel. The digital twin process schematic is shown in FIG. 2.
Two compressor models are available from the digital twin: the authors’ company’s compressor model and the local compressor model. The authors’ company’s compressor model is the actual model used when designing and performance testing the compressor, while the local model is based on the compressor map and equation of state. Access to the company’s model requires an internet connection, while the local compressor model is built into the digital twin application. The company’s compressor model selection provides the maximum fidelity and uses the original compressor design data to calculate the expected performance. This remote comparison with the original compressor design tool is superior to a simple map comparison, and is an integral part of the digital twin. Conversely, the compressor design performance data for the local model is transferred manually into the compressor digital twin application, using the compressor head vs. flow performance curve data.
Often, process instrumentation does not consider compressor external flow elements such as flowmeters, block or control valves, or the last/first section of piping that flanges up to the compressor. These exclusions are referred to as “instrument gaps” in that they distort the performance predictions and measurements around the compressor. Instrument gaps can have a significant effect on the compressor’s actual suction and discharge pressures. To maximize the accuracy of the process data sent to the compressor models, the digital twin calculates pressure at the compressor flanges, considering the pressure drops associated with these valves, flow elements and piping to minimize instrument gap errors.
The digital twin user interface includes compressor information configurations, process information configurations and performance comparisons. The interface also includes a pre-configured trending tool that enables both real-time and scalable historical data analysis (by adjustable time interval). Multiple performance maps are available for display on the local or remote interface. The primary ones are polytropic head vs. time, polytropic efficiency vs. time, shaft power vs. time, discharge pressure vs. time and pressure ratio vs. time. All other process variables can also be historically trended vs. time for comparison to performance values.
Vibration analysis. Accessing vibration data directly from the vibration monitor interface, the new CPMS advanced vibration analysis toola provides best-in-class vibration evaluation without requiring a commitment to an external enterprise solution. FIG. 3 shows a typical screen of the vibration interface.
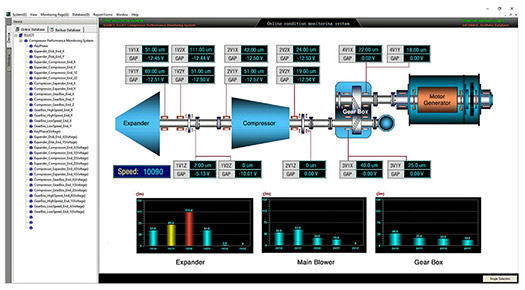
The CPMS collects high-resolution compressor data by connecting to the compressor control’s PLC and the compressor’s vibration monitoring system. This data is collected and stored in an integrated micro-historian database, accessed by the CPMS application softwarea, and presented in contextually relevant, easy-to-understand graphics. Sub, super and synchronous data are available in both the time domain and the frequency domain.
Graphical output options to the user include single- and multi-channel analysis and display; full train analysis and display; statistical analysis and alarm settings; real-time and historical trending; time domain waveform and pivotal (predictive) trajectory analysis; and frequency domain analysis, including both stationary and non-stationary analysis. The vibration interface and vibration analysis hardware is typically mounted into the machine monitoring cabinet and connects directly to the compressor vibration monitor. No additional machine monitoring hardware is required.
The CPMS vibration analysis interface connects to the buffered vibration monitor outputs using Bayonet Neill-Concelman (BNC) coaxial cables, and a BNC cable aggregator (supplied with the CPMS vibration analysis interface). The vibration analysis computer connects to the CPMS server using proprietary TCP communications. Graphical output plots that are available for advanced vibration analysis include options for time domain, frequency domain and mixed time-frequency domain. Specifically:
- Time-based graphical user output
-
- Single-/multi-channel analysis
- Full train analysis
- Statistical analysis
- Real-time and historical status and trending
- Time domain waveform and pivotal trajectories
- Frequency domain graphical user output
-
- FFT spectrum analysis
- Waterfall chart
- Full spectrum chart
- Full waterfall map (3D spectrogram in chronological order)
- Envelope analysis
- 2D dynamic holographic spectrum
- Sub-band analysis
- BODE diagram
- Time-frequency graphical user output
-
- Wavelet
- Short FFT
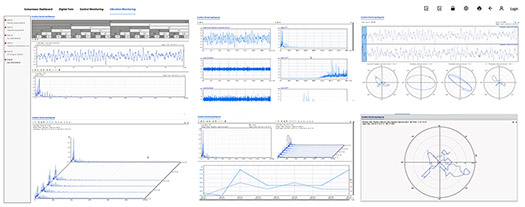
- Empirical modal decomposition (EMD).
FIG. 4. shows some of these vibration plots on a typical CPMS diagnostics screen.
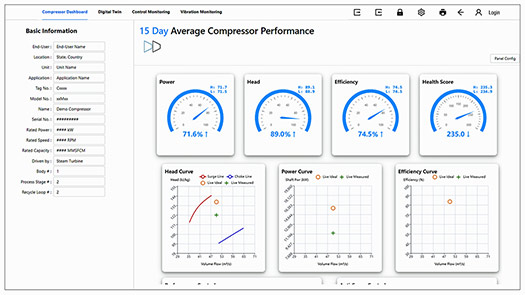
User dashboard. During normal compressor operation, the most convenient form to observe compressor health and performance is via the user dashboard. The dashboard screen provides the end user with basic information about the monitored compressor and overall compressor performance, control and vibration status. This is a convenient and fast way for the user to identify system problems, compressor upsets, performance loss and the overall health of the system (FIG. 5).
Remote monitoring. Many operators prefer to access their HMI compressor monitoring screens from remote locations, using personal digital devices such as laptops or smart phones. The remote control monitoring application provides a remote user with the same compressor controls data in the same format as the data presented by the local HMI. Using any smart device that supports a web browser, a remote user can access the CPMS via the internet and monitor a given compressor, similarly to a local user but without actually connecting to the local HMI. For operational security, remote access only permits monitoring, with no access to the control’s functionality—i.e., there is no ability to control remotely, but only to monitor.
Features of the remote monitoring access include “web-like” internet access to the CPMS with remote control monitoring that is “graphically” identical (or nearly identical) to the local control’s interface; limited read-only and navigation access (no controller “writes” such as setpoint changes, start/stopping pumps, etc.); responsive graphics (the graphics resize appropriately to the smart device display); no remote client software required apart from a standard internet browser; and two-factor user credential authentication to prevent unauthorized access.
The local CPMS server (with an individual IP address) is connected directly to the PLC that is controlling the compressor (and the associated driver, and auxiliaries). Remote users can connect to the CPMS server using a standard web browser. Once a remote user has connected to the CPMS (with two-factor authentication), they can view the CPMS dashboard, the digital twin, the vibration analysis tool and the “local HMI-twin” or remote control monitor using the CPMS drop-down menu.
Takeaway. Centrifugal compressor plant operators require control and monitoring functionality that allows them efficient and safe operation of their plant at the highest availability. Modern controls and monitoring systems, such as the authors’ companies’ new CPMS, include a host of advanced functionalities that are designed to allow operators to optimize the operation, maintenance and reliability of their plant. These features include advanced diagnostic tools, digital performance twins, user equipment health dashboards, historical trending and remote monitoring capabilities. All these features are seamlessly integrated with the compressor process, machinery protection and surge control to maximize performance and minimize downtime.H2T
NOTES
a Gemini Compressor Performance Monitoring system (CPMS)
About the authors

KLAUS BRUN is the Director of Research and Development at Elliott Group, where he leads a group of more than 60 professionals in the development of turbomachinery and related systems for the energy industry. His experience includes positions in product development, engineering, project management and executive management at Southwest Research Institute, Solar Turbines, General Electric and Alstom. He holds 12 patents, has authored more than 400 papers and has published five textbooks on energy systems and turbomachinery. Dr. Brun is a Fellow of the ASME and won an R&D 100 award in 2007 for his Semi-Active Valve invention, as well as the ASME Industrial Gas Turbine Award in 2016.

TODD OMATICK is the New Product Introduction Manager in Elliott’s Product and Technology Development group. He has been with Elliott for 24 yr, holding multiple positions focused on LNG. He holds BS and MS degrees in electrical engineering from the University of Pittsburgh.

JIM JACOBY is Senior Vice President in charge of technology at Tri-Sen Systems. Before joining Tri-Sen in 2009, Jacoby worked for Invensys for 14 yr in various engineering and marketing management roles. He also served as a turbomachinery engineer for M. W. Kellogg and a field engineer for Elliott Turbomachinery Co. Jacoby received a BS degree in mechanical engineering from the University of Houston in 1976.
Related Articles
Connect with H2Tech