Articles
A roadmap to decarbonize gray H2 production
Blue/Green H2 Production
J. MERTENS, KBC (a Yokogawa Company), Breda, Holland; T. BREW, KBC (a Yokogawa Company), London, UK; C. AMBLARD and C. LE GOAZIGO, WBCSD, Geneva, Switzerland
In 2021, the International Energy Agency (IEA) reported that the global demand for hydrogen (H2) reached 94 million metric tons per year (metric MMtpy), a 5% increase from 2020. H2 demand is projected to reach more than 200 metric MMtpy in 2030 and 530 metric MMtpy in 2050, according to the IEA’s “Global Hydrogen Review.”1 To meet the world's energy demand, more H2 must be produced in a much less carbon intensive manner to reach net-zero carbon emissions by 2050.
In support of the effort to limit global warming to 1.5ºC by 2050, the World Business Council for Sustainable Development (WBCSD)2 has written guidelines to help businesses align their H2 investments with the IEA’s Net Zero Emissions (NZE) scenario. The guide covers a variety of H2 production technologies, including:
- Green—using electrolysis with renewable electricity
- Gray—from fossil feeds and fuels, including steam methane reforming (SMR), autothermal reforming (ATR) and gasification
- Blue—from fossil gas with carbon capture.
The guide illustrates how these different technologies can align with the IEA NZE decarbonization pathway using a semi-quantitative approach to estimate the full lifecycle carbon intensity (CI) of the projects and the decarbonization impact of several carbon reduction solutions from now to 2050. The data used in the SMR section of this study was based on the authors’ company’s process simulations and expertise.
This article showcases the CI of gray H2 produced on SMRs and how to reduce it via various measures, including carbon capture and storage to make blue H2.
Lifecycle analysis. H2’s full lifecycle CI accounts for direct Scope 1 emissions from the SMR furnace stack, Scope 2 emissions related to the electricity supplied, and Scope 3 emissions affiliated with the upstream feed, fuel and downstream supply chains. Downstream Scope 3 emissions are deemed negligible if H2 is consumed near the production location.
To better understand where the CI originates, Eq. 1 shows how SMRs convert hydrocarbons from methane to naphtha and into H2:
CxHy+2xH2O+heat → xCO2+[(x+y)/2]H2 (Eq. 1)
This reaction stoichiometry is such that generating carbon dioxide (CO2) is an intrinsic and unavoidable part of creating H2 via this process. The carbon footprint of SMR-generated H2 is further increased when fossil fuels are used to provide the heat required.
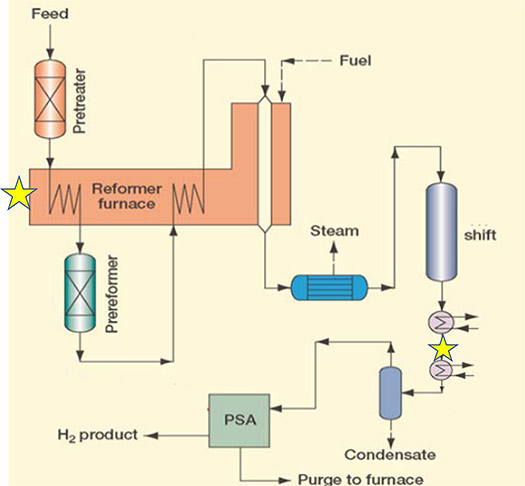
FIG. 1 shows that a typical SMR configuration consists of the reforming furnace (which converts light hydrocarbons into H2, CO and CO2), a shift reaction section (to further convert CO into H2 and CO2) and a pressure swing adsorption (PSA) purification section. Recovered heat is used to generate steam, the majority of which is used internally while the excess is exported to adjacent facilities.
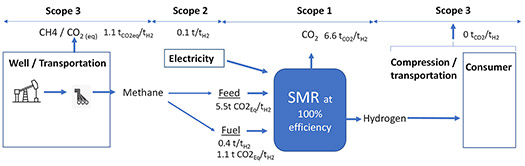
The focus will now shift to SMR-related lifecycle emissions, as shown in FIG. 2. The 6.6 metric t (tons) of CO2 of Scope 1 emissions are the theoretical stack emissions generated if methane is fired on a 100% efficient unit without steam exports. In reality, stack emissions are higher, especially for older, less efficient units, including those designed to export large amounts of steam. The SMR also requires electricity for compression and pumping, which increases CI. The 1.1 metric t of CO2 equivalent upstream emissions shown in FIG. 2 are related to methane leaks, nitrous oxides (NOx) emissions and the transportation of feed and fuel.3 This amount varies depending on how fossil fuels are sourced. Further details are provided below.
In practice, gray H2 produced from SMRs emits approximately 10 metric t of CO2/1 metric t of H2 produced as Scope 1 emissions. The CI of SMRs varies widely from 8 metric t of CO2/1 metric t of H2 to nearly 15 metric t of CO2/metric t of H2.4 This variability depends on the energy efficiency of the unit, the type of feed and fuel used, and the amount of high-pressure steam exported and how to account for this export.
Steam exports credits. Most SMRs are designed to export high-pressure steam as a byproduct. Steam exports will increase the stack emissions of the H2 plant due to the increased heat demand. More efficient SMRs equipped with PSA purification can provide steam exports up to 15 t of steam/t of H2. Consequently, up to 25% of the combined heat input from feed and fuel will be used for steam generation rather than H2 production itself. Note: Recent SMR designs often minimize or even eliminate steam exports. Therefore, when comparing SMR performance, it is better to consider the “corrected” SMR emissions (i.e., gross emissions corrected for the emissions credit related to steam exports).
Although generating CO2 is unavoidable due to the reaction itself, it is possible to minimize a unit’s emissions and make SMR H2 production reach net-zero (i.e., prevent H2 from increasing the amount of CO2 in the atmosphere). This will require action in the following three areas:
- Increasing unit efficiency
- Applying low carbon-intensity feeds and/or fuels
- Deploying carbon capture solutions.
SMR efficiency: Best technology performance. Overall SMR efficiency is primarily set by the thermal efficiency of the reformer furnace itself and the recovery of heat from the shift reactor effluent stream for use elsewhere in the process. In FIG. 1, the location of these critical variables is marked with a star.
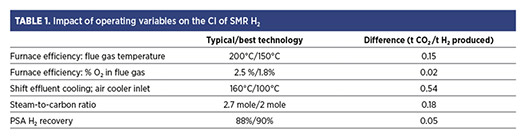
TABLE 1 shows how the main performance variables help reduce the H2-generated CI, as assessed by the SMR process model using a proprietary simulation platform.a The authors’ company defines best technology (BT) performance as what can be technically achieved if the process design is such that heat integration and recovery are maximized to the best available and economically viable technologies.
Feed carbon content. SMRs are typically designed to be fed and fired with relatively light hydrocarbons ranging from methane to naphtha. By replacing naphtha feed and fuel with natural gas, Scope 1 SMR emissions can be reduced by 25%. Additionally, the unit efficiency would increase by approximately 3% due to the reduced steam consumption and the reduced heat required to vaporize the liquid naphtha feed.
Accounting for greenhouse gases includes upstream emissions related to sourcing the feed and fuel, as well as downstream contributions related to transportation and distribution of the H2 product. SMRs that use biomethane rather than natural gas have a lower CI.
TABLE 2 shows a breakdown of the CI of different SMR feeds and fuels. CI is expressed in grams (gr) of CO2 emitted per megajoule (MJ) of lower heating value (LHV). The Scope 3 CI of naphtha was assumed to be identical to that of methane. This is an assumption that must be checked and possibly corrected if the impact of naphtha is investigated in detail. A CI of biomethane of 17 gr of CO2/MJ is applied, as reported by Element Energy in its August 2021 report.5 E-methane is another potential low-carbon methane source.
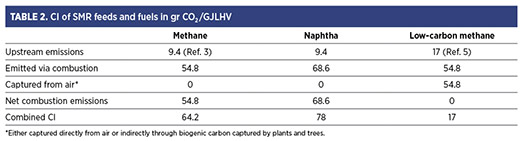
By replacing methane with low-carbon methane, CI is reduced by 47.2 gr of CO2/MJ (64.2 minus 17.0 gr/MJ), which represents 86% of Scope 1 emissions (54.8 gr of CO2/MJ) or reduces nearly 2.4 metric t of CO2 emissions per metric t of methane consumed.
The authors’ company has developed a decarbonization trajectory for a “benchmark” SMR with an efficiency of 5% below BT design, feeding/firing an 80 wt%/20 wt% mix of methane/naphtha and 12 metric t of steam exported for every 1 metric t of H2 produced. This unit represents the average performance of the current SMR fleet. FIG. 3 illustrates how this design will directly emit (Scope 1 only) 11 metric t of CO2/1 metric t of H2 (92 gr of CO2/MJ). Once the upstream contribution is included, the CI reaches almost 13 metric t of CO2/1 metric t of H2 (108 gr of CO2/MJ). After adjusting for the steam export, the net emissions drop to 10.3 metric t of CO2/1 metric t of H2 (86 gr of CO2/MJ).
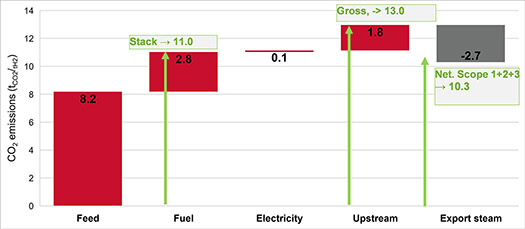
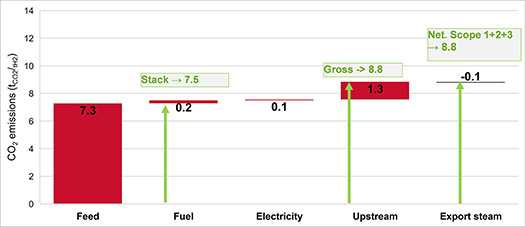
FIG. 4 shows the CI for a unit designed with BT and minimal steam exports. Compared to the benchmark unit, gross emissions are substantially reduced. This is due not only to improved unit efficiency but also to a design aiming to minimize steam exports. Nevertheless, a net emissions reduction from 10.3 metric t of CO2/1 metric t of H2 to 8.8 metric t of CO2/1 metric t was observed.
Carbon capture. It is only possible to reduce lifecycle emissions of blue H2 production using SMR to the lowest possible level by combining carbon capture with efficiency measures and low-carbon feedstocks. Two technical options are available for carbon capture: post-combustion capture from the furnace stack or pre-combustion capture from the shift reactor effluent (PSA feed). Different capture technologies exist using absorption, adsorption or cryogenic removal. The authors assert that chemical absorption capture will remain the most widely used technology for the near future.
The following sections explore paths toward net-zero that are consistent with the IEA's NZE pathway. This means that the evolution of lifecycle emissions over time is similar to the IEA’s NZE reduction path.
Pre-combustion strategies to reduce SMR H2 emissions were developed based on the simulation modela both for the aforementioned averaged benchmark unit and the grassroots plant.
Path to reach net-zero emissions: Pre-combustion capture. In pre-combustion capture, CO2 is removed from the process gas (shift reactor effluent)—not from the furnace stack—and does not capture emissions caused by fuel fired. With high steam exports increasing fuel consumption, it is best to minimize steam exports for a unit equipped with pre-combustion capture. Note: Not even pre-combustion capture removes the process carbon in the form of CO and methane.
Residual emissions would be minimized by:
- Reducing steam exports
- Maximizing overall unit efficiency
- Minimizing shift reactor CO slippage
- Minimizing reformer furnace methane slippage.
The unit design greatly influences these operating variables. Compared to the post-combustion capture case presented in the following section, the steam-to-carbon ratio in the pre-combustion simulation modela has been slightly increased to minimize residual process carbon. Furthermore, a low-temperature shift configuration is assumed to minimize residual CO to the capture installation for the best technology cases.
Emissions reduction measures will be implemented step-by-step, making it impossible to exactly match the IEA NZE curve. Implementing carbon capture is timed; therefore, the lack of CO2 removal before capture starts is offset by lower-than-IEA NZE emissions immediately following capture.
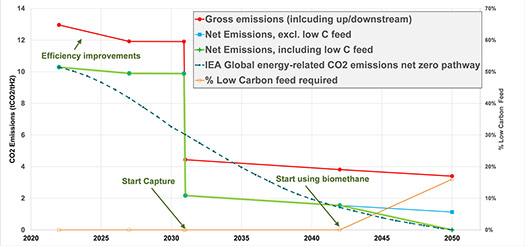
FIGS. 5 and 6 show how the reduction of emissions can be achieved using pre-combustion capture for the benchmark and BT units, respectively. Carbon capture is assumed to be done using amine absorption and the regeneration of the amine solution, which requires substantial amounts of low-level heat, most likely low-pressure steam. The needed low-level heat is assumed to be generated by fossil methane. Still, the CI of heat is expected to gradually drop to 50% of fossil methane by 2050.
The contribution of improved unit efficiency is expected to be relatively limited. The process side with the reactors, the steam generation section and the reformer furnace are highly integrated. Because of this, reconfiguring one section for increased heat recovery will affect the other sections, which then may also require additional investment. This will significantly increase capital costs. Because of this knock-on effect, it is expected that for the benchmark SMR that only 25% of the performance gap with BT can be achieved through economically justifiable revamps. The impact of this improvement in the reduction of the gross emissions by 2027 is shown in FIG. 5.
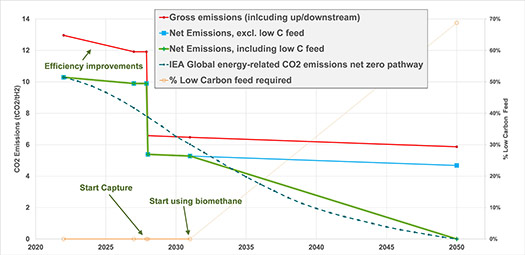
Pre-combustion capture removes about 60% of carbon present in the feed and fuel of the benchmark unit (Scope 1). The residual 40% of the carbon directly emitted into the air is due to the make-up fuel fired, the CO and methane in the process stream, and the CO2 that slips through the capture installation.
To remain on track with the IEA NZE decarbonization path, pre-combustion carbon capture must be implemented on the benchmark SMR soon after 2025, as shown in FIG. 5.
The green curve tracks the substitutions of the fossil feed by low-carbon alternatives and should start before 2030. The blue curve (showing emissions excluding the impact of biomethane) overlaps with the green curve (including the impact of biomethane) until 2035.To achieve net-zero by 2050, nearly 70% of fossil feed must be replaced with biomethane. Note: The low-carbon feed is assumed to have a CI of 17 gr of CO2/MJ (TABLE 2), and the fuel should remain fossil natural gas.
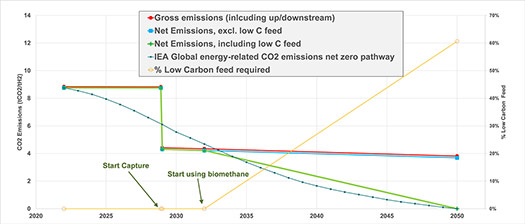
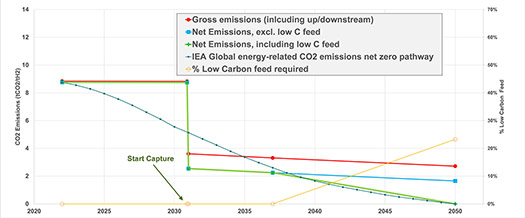
If the unit is designed with the BT, then pre-combustion capture reaches 74% of combined (Scope 1) feed and fuel carbon vs. 60% for the benchmark case. Two reasons account for this: (1) the reduced fuel intake and (2) the increased conversion of CO and methane into CO2 in the furnace and shift reactors. The increased capture ratio explains why the low-carbon feed requirement is lower in the BT case than in the benchmark case. However, FIG. 6 demonstrates that this does not have much impact on the timing of the implementation of carbon capture.
The gross and net emissions curves are nearly identical in FIG. 6 because the BT case assumes a design with virtually no steam exports.
Path to reach net-zero emissions: Post-combustion capture. Post-combustion capture treats all furnace stack (Scope 1) CO2 emissions. The removal amount is determined by the efficiency of the CO2 capture unit, which fluctuates around 90%.
Both capture and low-carbon feeding can start later in the case of post-combustion capture compared to pre-combustion capture. Moreover, FIGS. 7 and 8 indicate a significant reduction of the fraction of low-carbon feed.
Surprisingly, the BT configuration requires higher levels of low-carbon feeds than the less-efficient benchmark case. Since 90% or more of the carbon in the fuel used to generate the export steam is captured, it will result in an emissions credit for the exports themselves.
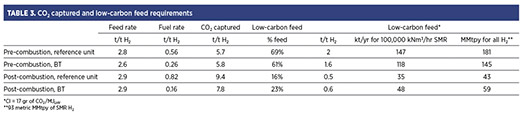
TABLE 3 indicates that post-combustion may be preferred to pre-combustion, which requires much larger quantities of low-carbon feeds or fuels. Low-carbon fuels are, and may remain, much more expensive than their fossil counterparts. However, in contrast to pre-combustion, post-combustion capture is more capital-intensive, more costly to operate and generates higher amounts of CO2 to dispose. Therefore, pre-combustion could be the optimal solution when CO2 disposal is constraining or expensive, if low-carbon fuels are moderately priced or when the residual stack emissions can be compensated cheaply elsewhere other than by using low-carbon feeds.
NOTES
a Petro-SIM®
LITERATURE CITED
1 International Energy Agency (IEA), “Global Hydrogen Review 2022, September 2022, online: https://www.iea.org/reports/global-hydrogen-review-2022
2 World Business Council for Sustainable Development (WBCSD), online: www.wbcsd.org
3 European Commission, “JEC Well-to-Tank report v5,” JRC Publications Repository, online: https://publications.jrc.ec.europa.eu/repository/handle/JRC119036
4 Mertens, J., “Refinery CO2 challenges: Part II,” Petroleum Technology Quarterly, Q2 2006.
5 Zemo Partnership, Low Carbon Hydrogen Well-to-Tank Pathways Study—Full Report,” Element Energy, August 2021, online: https://www.element-energy.co.uk/wordpress/wp-content/uploads/2021/08/Zemo-Low-Carbon-Hydrogen-WTT-Pathways-full-report.pdf
About the authors
JORIS MERTENS serves as a Principal Consultant at KBC (A Yokogawa Company). He is a veteran process technology engineer with a record of accomplishment of helping individual fuel refineries and integrated refinery/petrochemical complexes worldwide aim for net-zero emissions while maintaining profitability, which is a crucial piece of the decarbonization puzzle.
THOMAS BREW serves as a Senior Engineer at KBC (A Yokogawa Company). His work focuses on the identification and implementation of energy-efficiency improvement opportunities, and the development of energy management systems across upstream, downstream and chemicals sectors.
CAROLINE AMBLARD is passionate about transforming the energy system towards net-zero emissions. She has been working around the globe for Shell for 18 yr in diverse businesses (upstream, integrated gas, shipping and integrated roles), always with a focus on health, safety and environment (HSE). She was seconded to lead the Hydrogen workstream at WBCSD, bringing companies together to accelerate the deployment of hydrogen with the lowest possible carbon intensity. In her latest role, Amblard supports Shell’s Project and Technology directorate globally to operationalize the group’s net-zero and respecting nature ambitions.
CÉLINE LE GOAZIGO has been the Hydrogen Lead at the World Business Council for Sustainable Development (WBCSD) since October 2022. She coordinates activities for scaling up low-carbon H2 with leading companies from various sectors worldwide. Her recent achievements include identifying success factors of emerging H2 projects and working on assessing positive externalities of H2 through the integration of sustainable development goals in H2 business models. Before facilitating energy transition discussions at WBCSD, she worked as an engineer at Electricité de France (EDF) in various positions dealing with energy markets, assets optimization, energy risk control, negotiation of long-term power purchase agreements and sustainable finance. When she is not working to make the energy transition a reality, Le Goazigo loves playing music and enjoys spending time outdoors.
Related Articles
Connect with H2Tech