Articles
Green H2: A global overview and the role of renewables
Editorial Comment
T. CAMPBELL, Managing Editor
It is well known that producing green hydrogen (H2) requires zero-emissions electricity generated by renewable energy (e.g., solar and wind) for electrolysis. For this reason, strategically placing H2 production facilities near renewable power sources is convenient. According to Gulf Energy Information’s Global Energy Infrastructure Data Center, there are 1,187 green H2 projects worldwide. Of the 1,187 projects, 626 are located in Europe, 141 are in North America, 37 are in the Middle East, 59 are in Central/South America, 265 are in the Asia-Pacific region and 59 are in Africa.
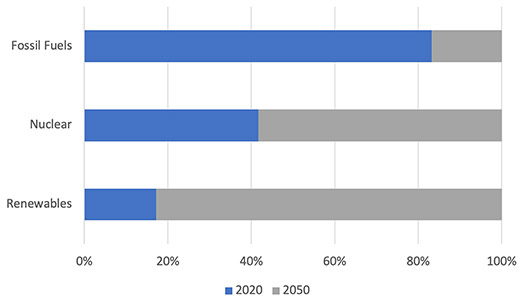
For the 1.5°C Scenario to become a reality, electricity generation must increase more than three-fold by 2050, with a majority coming from renewable sources. According to the International Renewable Energy Agency (IRENA), 94% of H2 production is expected to come from renewables by 2050.1 Additionally, the total primary energy supply by energy group will be 77% renewables, 7% nuclear and 16% fossil fuels in 2050 compared to 16% renewables, 5% nuclear and 79% fossil fuels in 2020.1 This is a 381.25% increase in renewables energy supply (FIG. 1).
Renewable energy is critical to progressing the H2 economy and reducing global emissions. According to the International Energy Agency (IEA), the main global dispatchable renewables in 2050 will be hydropower (12%), bioenergy (5%), solar (2%) and geothermal (1%).2 In 2022, the leading country in installed renewable energy capacity was China with 1,161 gigawatts (GW), followed by the U.S. (352 GW), Brazil (175 GW), India (163 GW) and Germany (148 GW), according to Statista.3 China’s massive lead in renewable energy capacity correlates with the IEA’s report on the country’s electrolyzer capacity. According to the IEA, China had nearly 220 megawatts (MW) of cumulated electrolyzer capacity in 2022, and 750 MW is expected to be online by the end of 2023.4
LITERATURE CITED
1 IRENA, “World energy transitions outlook 2023: 1.5°C pathway, Volume 1,” June 2023, online: https://mc-cd8320d4-36a1-40ac-83cc-3389-cdn-endpoint.azureedge.net/-/media/Files/IRENA/Agency/Publication/2023/Jun/IRENA_World_energy_transitions_outlook_v1_2023.pdf?rev=cc4522ff897a4e26a47906447c74bca6
2 IEA, “Net zero by 2050: A roadmap for the global energy sector,” May 2021, online: https://iea.blob.core.windows.net/assets/deebef5d-0c34-4539-9d0c-10b13d840027/NetZeroby2050-ARoadmapfortheGlobalEnergySector_CORR.pdf
3 Statista, “Leading countries in installed renewable energy capacity worldwide in 2022,” August 2023, online: https://www.statista.com/statistics/267233/renewable-energy-capacity-worldwide-by-country/
4 IEA, “Hydrogen,” July 2023, online: https://www.iea.org/energy-system/low-emission-fuels/hydrogen
Related Articles
Connect with H2Tech