Articles
Online Feature: The measurement of H2 spin isomers using in-line solid state Raman spectroscopy
T. DEARING and J. RICHMOND, Thermo Fisher Scientific, Seattle, Washington; A. SIAHVASHI, Massachusetts Institute of Technology (MIT), Cambridge, Massachusetts
Hydrogen (H2) is increasingly viewed as a key player in creating a decarbonized energy future, with the transportation and storage of liquid H2 being pivotal for its widespread use. Ensuring safety and efficiency in the liquefaction and storage of H2 is essential for its viability. Crucially, selecting the best liquefaction methods and transport/storage technologies involves analyzing multiple factors, including energy use, material choices and liquid H2 management, such as ortho/para H2 conversion and boil-off gas.1
H2 exists as two isomers (ortho and para) based on a proton nuclear spin. A temperature-dependent equilibrium dictates their ratio, with 75% ortho at room temperature shifting to nearly 100% para at liquid H2 temperatures [20 kelvin (K)]. This transition releases significant energy, impacting liquefaction and storage processes. Due to quantum effects, the ortho-to-parahydrogen transition requires an external catalyst: without one, the process is slow, taking days or weeks if rapidly cooled. This conversion is exothermic, releasing more heat [525 kilojoule (kJ)/ kilogram (kg)] than H2's vaporization enthalpy at its boiling point (448 kJ/kg), affecting storage strategies and safety.1,2
Efficient ortho-to-parahydrogen conversion is crucial for H2 liquefaction and storage on an industrial scale. Rapid liquefaction without allowing time for this conversion can lead to excessive boil-off gas and the potential over-pressurization of storage tanks, posing safety risks. Additionally, the slow conversion process is a significant barrier to long-term storage, as the heat generated can evaporate more than 70% of the stored liquid H2 in a couple of days.1
Conversely, the reverse reaction, where parahydrogen converts back to orthohydrogen, is an endothermic process that can further cool liquid H2, reducing boil-off. This conversion plays a crucial role in maintaining the cryogenic temperature of stored H2, enhancing its stability and efficiency.2
The catalyst materials are incorporated into the design of industrial H2 liquefaction systems to expedite the conversion process—this can be achieved within minutes. However, there is significant demand for detailed data on the reaction rates specific to these catalysts to enhance the accuracy of kinetic models used in reactor design, especially for exploring different reactor configurations.3
In the past decade, Raman spectroscopy has experienced significant advancements, becoming a powerful analytical technique in various industrial applications. Improvements in lasers, solid-state hardware and fiber optics have played a crucial role in enabling these developments. Raman spectroscopy, particularly in process analytical technology (PAT) applications, has seen substantial growth. Its ease of interface, non-destructive sampling and rapid cycle times have facilitated successful integration into diverse sectors, such as biopharma, oil and gas, petrochemical and fermentation applications. The incorporation of Raman spectroscopy into workflows for in-line measurements requires minimal adjustments. Moreover, the combination of Raman spectroscopy with chemometric methods has expanded its adoption in industrial applications, contributing to its versatility and effectiveness in various fields.
This article demonstrates the use of a process Raman analyzer performing in-line compositional analysis to calculate the ortho/para ratio and the conversion rate under different experimental conditions.
COMMON ORTHO/PARA MEASUREMENT TECHNIQUES
Raman spectroscopy, nuclear magnetic resonance (NMR) spectroscopy and thermal conductivity measurements are key techniques for the detection of ortho and para H2. Raman spectroscopy stands out as ideal for this purpose due to its ability to provide relative measurements of the isomer ratios without the need for calibration, as well as offering online measurement capabilities.2 However, questions remain about its long-term performance in cryogenic conditions and sensitivity at different temperature and pressures. NMR spectroscopy detects orthohydrogen directly (parahydrogen is NMR-invisible) but requires calibration and can face challenges with signal-to-noise ratios at lower temperatures, although advanced techniques can enhance parahydrogen signals.4 Thermal conductivity measurements exploit the significant thermal conductivity differences between the two isomers, but they are limited by pressure and temperature conditions and are unsuitable for liquid H2.5
The fast analysis times and ease of sample interface (using a high-pressure at low-temperature flow cell) make Raman spectroscopy ideal for tracking the conversion of ortho-to-parahydrogen. The Raman spectrum of H2 contains specific peaks that pertain to the ortho and para isomers of the diatom. Raman peaks scale linearly with concentration. This means the peak area of the specific ortho and para peaks can be tracked and used to calculate the compositional ratio. Simple background correction and baseline correction further increase the accuracy of the determined peak areas and subsequent compositional ratios.
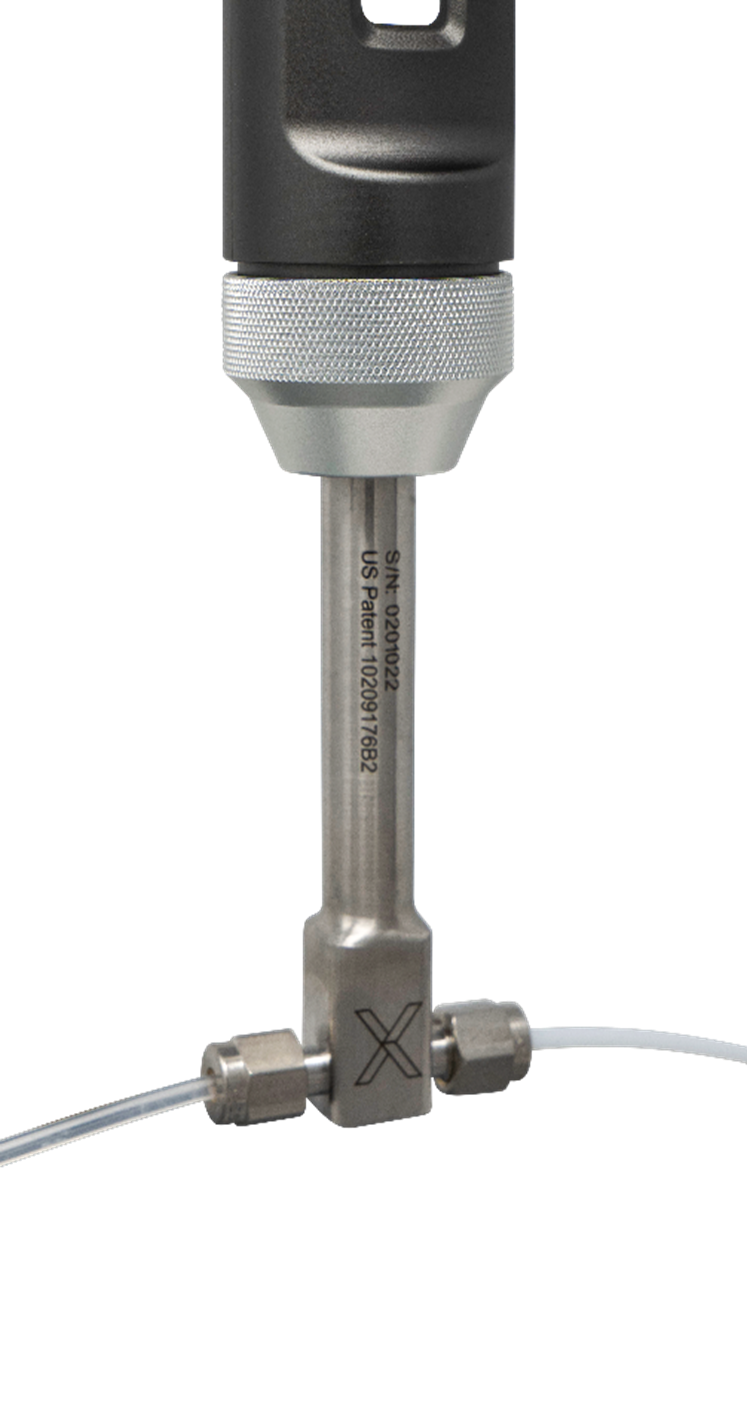
Experimental. All spectra were collected on a Raman analyzera, and the acquisition parameters were set to collect a new dark subtracted spectrum every 10 sec. The spectra were collected using a flow cell sampling opticb rated to 2,500 psi and a temperature range from cryogenic temperatures (77 K) to 350 K (FIG. 1).
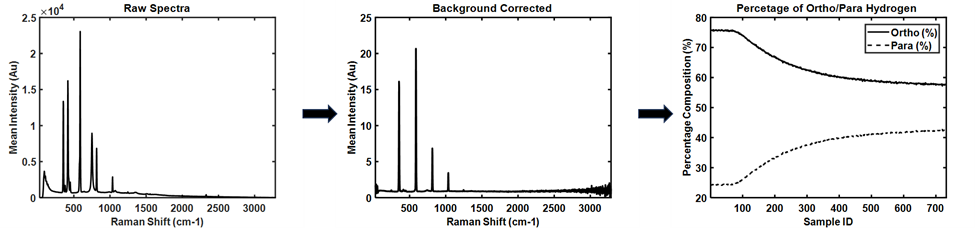
Once collected, the data was processed using data analysis softwarec. Background removal was performed using a spectrum of helium, followed by a trend analysis that accounts for baseline variation. Finally, normalization was performed to account for variations in pressure and flow. The resulting model files were transferred to the Raman instrument and were deployed using a solo predictord to make real-time determinations of the ortho and para content of the liquid H2 (FIG. 2).
In this experiment, H2 gas was first cooled in a heat exchanger immersed in liquid nitrogen, then passed through a packed-bed reactor containing a commercially available iron-based catalyst. This process facilitated the conversion of ortho-to-parahydrogen, altering its equilibrium from 75% (room temperature) ortho to 50%. The temperature, pressure and flowrate were continuously monitored and regulated. Downstream of the reactor, a Raman probe (with the flow cell shown in FIG. 1) was deployed to measure the ortho/parahydrogen concentrations in real time, providing immediate insights into the efficiency of the catalyst and conversion process.
Results and discussion. Raman spectroscopy was successfully deployed to measure the catalytic conversion of the ortho-to-parahydrogen process. This successful outcome was due in part to the flow cell sampling optic used to make the measurements. The employed flow cell was notably compact and integrated, designed for in-line utilization and connected via compression fittings. This configuration facilitated a straightforward plug-and-play installation and ensured leak-free operation, eliminating the need for the user to adjust or address potential complications related to the laser's focal points or other adjustments.
The experiments conducted in this study were carried out with the flow cell at ambient temperature. Nonetheless, the flow cell is capable of being submerged in liquid nitrogen (77 K) or operated in conjunction with a cryocooler to achieve temperatures as low as 20 K, assuming the probe stem is sufficiently long and thermally regulated to prevent damage to the electronic components.
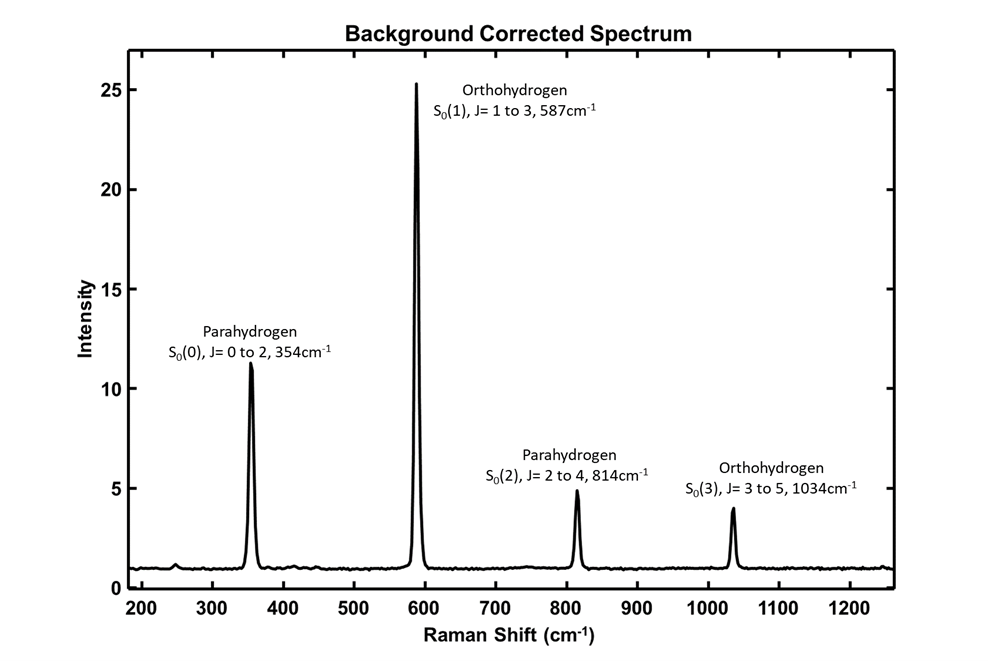
The spectra collected using the flow cell showed clear transitions of ortho-to-parahydrogen. The signal-to-noise ratio was excellent, allowing clear resolution and distinction of the relevant liquid H2 peaks (FIG. 3). The corresponding rotational states (J) and zero vibrational transition states (S) for a measured H2 spectrum have been shown in FIG. 3. The quantified Raman shifts, corresponding to the parahydrogen peaks, are recorded at 354 cm-1 and 814 cm-1, respectively, while the orthohydrogen peaks are observed at 587 cm-1 and 1,034 cm-1, respectively. These findings are consistent with the H2 Raman spectra delineated in the literature, affirming the reliability and accuracy of the measured shifts within the context of established spectroscopic data.2
The instrument sensitivity allowed for a high degree of resolution of subsequent samples and precise tracking of the catalytical conversions. Using these signals, several experiments were undertaken to monitor various factors, including conversion efficiency and kinetic rates. The chemometric methods applied required no additional calibration other than the understanding that at room temperature the ratio of ortho-to-parahydrogen is approximately 3:1.
Takeaways. This study shows that Raman spectroscopy is an ideal spectroscopic technique for the measurement and monitoring the ortho-to-parahydrogen conversion at cryogenic temperatures and high pressures. Information on conversion rates, catalyst efficiency and performance are possible due to fast data acquisition rates, and excellent signal-to-noise performance and resolution. By removing background interferants, particularly the 585 cm-1 corresponding to sapphire peak, very small changes in peak height/area can be monitored with confidence, resulting in extremely accurate conversion rates.
The cryogenic flow cell enables measurement in liquid H2 at 20 K, further enhancing the accuracy, precision and speed of analysis due to the higher density of the liquid phase compared to the gas phase. It is envisaged that analysis times will decrease from 10 sec to 200 milliseconds, enabling catalysis research using extremely fast acting materials. This will enable extremely large volumes of H2 to undergo 100% conversion to the parahydrogen form in a short period of time, ensuring efficient storage and transportation of the liquid form with minimal losses due to boil-off.
Furthermore, the success of this application provides a pathway into other arenas that require the accurate determination of H2 and its isotopes, such as reducing carbon footprint by blending significant levels of H2 into natural gas fuel for power generation and monitoring H2/deuterium feed to a fusion reactor for power generation for the future.
Notes
a Thermo Scientific™ MarqMetrix All-In-One Process Raman Analyzer
b Thermo Scientific™ MarqMetrix FlowCell Sampling Optic
c Eigenvector Research Solo 9.2.1
d Eigenvector Research Solo Predictor 4.3
LITERATURE CITED
1 Ghafri, A., et al., “Hydrogen liquefaction: A review of the fundamental physics, engineering practice and future opportunities,” Energy Environ Science Journal, 2022.
2 Bunge, C., et al., “A high-fidelity, continuous ortho-parahydrogen measurement and conversion system,” PhD Thesis, Washington State University, Washington (U.S.), 2021.
3 Ilisca, E., F. Ghiglieno, et al., “Nuclear conversion theory: Molecular hydrogen in non-magnetic insulators,” Royal Society Open Science, 2016.
4 Krasae-in, S., et al., “Development of large-scale hydrogen liquefaction processes from 1898 to 2009,” International Journal of Hydrogen Energy, 2010.
5 Zhou, D., et al., “Determination of the ortho-para ratio in gaseous hydrogen mixtures,” Journal of Low Temperature Physics, 2004.
Related Articles
Connect with H2Tech