Articles
The economic challenge with renewable energy
Renewables for Hydrogen Generation
R. WILLIAMS, ENODA and Center for Climate Finance and Investment, Imperial College London, Edinburgh, United Kingdom
The growing penetration of intermittent renewable energy sources, such as wind and solar power, poses challenges to the reliable and secure operation of power systems.1 Although the marginal cost of a unit of renewable electricity is seemingly much lower than that of electricity produced by burning fossil fuels based on conventional measures, the non-linearity of the supply curve and the unpredictability of renewables mean that, in practice, renewables are often more expensive to consumers than fossil fuels.
This phenomenon ultimately arises due to the costs associated with balancing supply and demand in real time and minimizing the deviations between scheduled and actual generation. This need to decrease costs to balance the grid is caused by the underlying physics maintaining the stability of the grid—supply and demand (generation and load, respectively)—and must be constantly balanced or the grid experiences frequency problems and, in severe cases, blackouts if system operators do not intervene to correct the frequency.
The costs to correct these frequency problems, known as balancing costs, have significant implications for the efficient operation of power systems and the integration of renewable energy sources. This article outlines the microeconomic basics underlying electricity balancing costs and empirically documents their increasing nonlinear relationship with the rising penetration of wind and solar electricity generation using a panel dataset of several European countries. The implications of this research are profound, as it sheds light on the challenges and opportunities of the transition to a more sustainable energy system.
As demonstrated through a simple microeconomic framework, the primary factors influencing electricity balancing costs include the variability and uncertainty of renewable energy generation and demand fluctuations. The intermittency of renewable energy sources introduces a higher degree of uncertainty in forecasting electricity supply and, therefore, predicts increasing balancing costs as an increasing function of wind and solar penetration into an electrical system.
The article then examines data on the time series of balancing costs in the UK and determines that they have increased dramatically in the last 3 yr. This is due to the various problems of uncertainty inherent to renewables noted above, coupled with the steep supply curve at high output levels. Moving beyond univariate observation to a regression framework, a hand-collected panel dataset is used, containing information on balancing costs and wind/solar penetration for five European markets to examine the relation between wind/solar penetration and balancing costs.
A nonlinear increase is found in balancing costs as wind/solar penetration rises. The model's prediction of balancing costs at the 70% wind/solar threshold, according to the International Energy Agency's (IEA's) net-zero forecast, results in balancing costs of nearly $1,000/MWh, which are likely to be politically infeasible.
In market-based power systems, various mechanisms allocate electricity balancing costs to market participants. Generators, retailers and consumers may face penalties or receive incentives based on their imbalances between scheduled and actual electricity flows. These costs are important considerations for market participants in their decision-making processes, such as determining the optimal mix of generation technologies and deploying energy storage systems. Optimal decision-making is vital because, ultimately, consumers pay for these costs in their electrical bills or taxes.
System operators play a critical role in managing electricity balancing costs. They employ advanced forecasting techniques to anticipate imbalances and utilize different resources for real-time balancing, including conventional power plants, energy storage systems, demand response programs and interconnection capacities. The selection and dispatch of these resources are driven by their availability, cost-effectiveness and technical characteristics. The predicted values of balancing costs at high levels of wind/solar penetration call to question whether the current mechanisms used by system operators are fit for purpose for the grid of the future.
Finally, the article examines a common policy solution and its expected impact on balancing costs. The deployment of flexible resources, such as energy storage systems and demand response programs, is commonly proposed as a solution to enhance the system's ability to manage imbalances effectively. Furthermore, the inclusion of distributed energy resources, such as rooftop solar panels and electric vehicles, in balancing markets could potentially increase the pool of available resources for balancing purposes.
However, it is noted that they also introduce additional challenges with load forecasting. Given grid technology, these resources are unlikely to make a significant contribution to balancing costs, although technological advancements could increase their role in future years, a potential development that consumers should be aware of.
Electricity balancing costs are a significant consideration in the operation and planning of power systems. Academic literature has studied frequency responses in a variety of ways, such as balancing, voltage control and frequency control.2,3,4,5,6 How intermittency results in price volatility, resulting in negative spot prices, increased variance in wholesale markets and the increased need for costly stand-by capacity has also been documented.7,8,9,10,11,12 One study examined spillover effects between balancing and wholesale markets, and another examined an engineering measure of imbalance (ACE) and its relation to wind penetration.13,14 As much of the U.S. grid balancing activities do not use market mechanisms, the cost of this imbalance cannot be estimated. By using data on European grid balancing, which uses an auction mechanism, the actual economic costs of renewable energy generation can be demonstrated.
The increasing integration of renewable energy sources and the need for grid flexibility pose significant challenges and provide cost-effective balancing opportunities. Market participants, system operators and policymakers should collaborate to develop innovative solutions that promote efficient and sustainable electricity balancing while ensuring grid reliability and affordability.
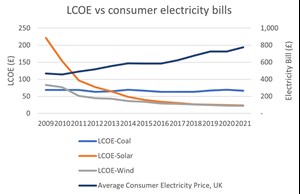
Background. The levelized cost of electricity (LCOE) is a standard metric used to estimate the lifecycle cost of various electricity sources. FIG. 1 illustrates the trend in the UK, showcasing a significant and continuous decrease in LCOE for intermittent renewable energy sources—particularly wind and solar— positioning them well below the LCOE of traditional fossil fuels. This trend highlights renewables' perceived growing economic competitiveness, fostering a strong argument for their widespread adoption to achieve a cleaner and more sustainable energy future.
However, an apparent paradox arises when observing the average annual consumer electricity bill, which shows a steady increase despite the declining LCOE for renewables. As renewable energy penetration increases, the weighted-average LCOE should be falling. So, why then are consumer prices increasing?
One key factor contributing to this disparity is the complex interaction between the LCOE of generation sources and the overall electricity pricing structure. The LCOE represents the cost of producing electricity from a particular source but does not encompass the entire supply chain and distribution costs that ultimately partially determine consumer prices.
Given that LCOE is meant to include the total costs over the project's life, it is clear that an important cost further down the supply chain is missing from this commonly used calculation. These costs must rise with increased renewables penetration to explain this phenomenon and are the subject of this study.
Much has been written accurately about the negative environmental externalities associated with traditional fossil fuel-based electricity generation. However, these generators also have several positive externalities related to grid stability. These power plants, fueled by coal, natural gas or oil provide reliable and consistent sources of electricity that are essential to maintain a stable power grid.
Unlike renewable energy sources like solar and wind, which are subject to weather fluctuations, fossil fuel generators can operate continuously, ensuring a steady electricity supply regardless of weather conditions. Unlike nuclear, their ability to ramp up or down quickly allows grid operators to respond swiftly to changes in electricity demand, providing vital flexibility to balance the grid and meet peak demands.
Additionally, fossil fuel generators are a reliable backup source when renewable energy production is insufficient. Despite concerns about their environmental impact, these power plants remain a critical component of the energy mix, supporting grid stability and ensuring a consistent and dependable electricity supply.
It has been challenging to dislodge fossil fuel-based electricity generators because the increasing integration of renewable energy generation presents challenges, notably higher balancing costs. Renewable sources like solar and wind are inherently intermittent, influenced by weather patterns and daily cycles, leading to fluctuations in energy production. Managing these fluctuations can be expensive and the costs are passed to consumers through higher electricity prices.
This article begins by mapping out the economic intuition of increasing balancing costs in a simple economic framework using supply and demand curves. In a simplified manner, this framework demonstrates the near-constant battle faced by the electricity system operator (ESO) in balancing the electricity grid.3 This exercise shows that higher balancing costs are a near-guaranteed outcome of adding renewable energy sources to the grid. Nuclear energy does not solve this problem. Empirical evidence using a panel dataset of five countries supports this interpretation.
As a result, to arrive at a carbon-neutral future, grid operators must invest in sophisticated energy storage systems, demand response mechanisms and enhanced grid management tools to balance supply and demand effectively.
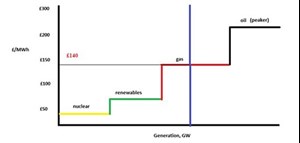
Economic framework. To balance the grid, the ESO builds a generation stack, often on a day-ahead basis. This generation stack organizes electricity generators from lowest to highest marginal cost and will use the least expensive sources of electricity first. An economist would refer to this completed generation stack as a supply curve, as plotted in FIG. 2. The demand curve at the consumer level is presented as perfectly inelastic, as consumers expect a consistent supply of electricity and are generally shielded from short-term price variations. The prices in FIG. 2 are for illustration only.
As in classical economic markets, the supply and demand curves intersect at £140/MWh in this example, which sets the day-ahead market price for electricity in the simplified framework. Systems operators use this basic economic mechanism to ensure there is enough expected generation (supply) to meet the expected load (demand). Note further that, in most countries, the marginal generator continues to be coal or natural gas. Due to the price-setting mechanism, all generators supplying electricity are paid at the market price of £140/MWh, including wind/solar operators.
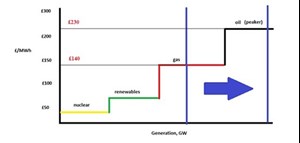
What causes balancing problems? Two types of balancing prices are explored using this simple framework. The first is an inaccurate estimate of day-ahead load or demand. Unanticipated increases in load shift the demand curve to the right and require the ESO to incentivize additional generation sources to come online (FIG. 3).
In this example, oil peaker plants are needed to keep the system balanced, and the clearing price increases to £230/MWh. The difference of £90/MWh is a balancing cost that is ultimately passed to consumers.
Load forecasting has always been challenging for ESOs; however, installing behind-the-meter technologies, such as rooftop solar and at-home battery storage, has increased the complexity of load forecasting. Electric vehicle (EV) charging stations are also likely to reduce load forecasting accuracy, at least initially. The generation mix also affects the ability to respond to changes in load rapidly. The system's flexibility decreases as more renewables are added to the grid.
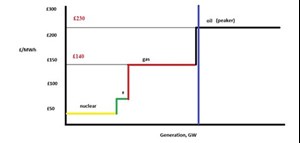
This leads to the second general type of balancing problem. The intermittency of renewable energy sources such as wind and solar requires detailed weather and load forecasting: basically, sometimes the sun does not shine, and the wind just does not blow (FIG. 4).
There is not enough solar/wind generation to meet the initially forecast load, requiring fossil fuels to meet the expected demand and maintain a balanced grid. These problems worsen with the increase in renewable generation, as the classic fossil fuel generators have several characteristics, such as flexibility and inertia, that partially offset these problems.
What about favorable deviations? The above examples result in a mismatch between supply and demand where the generation was insufficient to meet the downstream load. The reader may wonder whether or not these examples are contrived. For example, if renewable energy merely increases variance, there are situations where the generated energy is more than sufficient to meet the load.
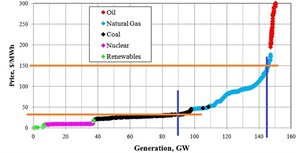
Unfortunately, these situations can still create balancing problems. In the extremes, this causes negative spot prices, where the system's operator must pay agents to remove electricity from the grid. Additionally, real-world generation stacks are highly nonlinear. For example, FIG. 5 presents the generation stack for Pennsylvania in 2008.
As shown, the non-linearity means that mistakes on either side of the forecast do not simply average out. Rather, the last parts of the supply curve are incredibly expensive to utilize. Therefore, using fossil fuel generators to balance instability created by renewable energy sources is becoming increasingly expensive.
Based on this simple example, an astute reader may also wonder whether, had the system operator correctly predicted load or generation on a day-ahead basis, the balancing price would have been the day-ahead price. In this case, there is no economic loss. However, in reality, the balancing cost is not simply the difference between the realized wholesale price and the anticipated day-ahead price (thus netting out to zero in terms of the counterfactual), as balancing the grid in real time encapsulates much more than just inaccuracies in weather or load forecasting affecting supply curves.
In addition to the fact that quick-response peakers are often not the same generators as those participating in the day-ahead market, balancing costs also reflect a complex interplay of forecasting errors, the operational flexibility of power systems, market dynamics, the cost of ancillary services to maintain grid reliability and the impact of unexpected events. These factors collectively influence the need for real-time adjustments and the associated costs, thereby explaining why balancing costs cannot be solely attributed to the difference between the day-ahead forecasted price and what that price would have been with perfect forecasting.
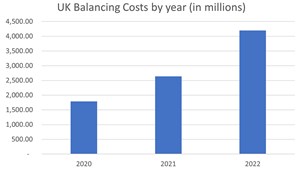
Empirical results. In the economic intuition above, a positive correlation in the time series between balancing costs and renewable generation capacity should be expected. Is this what is observed? FIG. 6 shows the total balancing costs for the UK ESO, National Grid, from 2020–2022.
The balancing costs have more than doubled in 2 yr. This is despite an installed solar and wind capacity increase of 14% over the same period. The next section attempts to formalize this univariate observation empirically.
Many U.S.-based studies on intermittent renewables do not explore balancing prices directly or use the Electric Reliability Council of Texas (ERCOT) data. This is because only a few U.S. states balance the grid in an open-market auction system (ERCOT in Texas is an exception). In contrast, European markets use an auction-based market clearing process to generate market prices of balancing costs per MWh. Because Europe does not have the gas reserves that Texas has (and many European countries have pledged to phase out fossil fuels), balancing costs are much higher than in Texas.
The database contains balancing costs, the penetration of wind and solar, and natural gas prices on a monthly average basis from January 2019–November 2023. The data on balancing costs are manually collected from information provided by ESOs. Due to data availability, this section focuses on the Netherlands, Poland, Portugal, Sweden and the UK. Data on balancing costs for the Netherlands, Poland, Portugal and Sweden comes from the self-reported data given to the European Network of Transmission System Operators for Electricity (ENTSOE). For the UK, this data is collected from ELEXON.
The generation data from the Netherlands, Poland, Portugal and Sweden are collected from ENTSOE, and the UK from National Grid ESO. The natural gas spot price is the Henry Hub natural gas spot price from the U.S. Energy Information Administration (EIA).
The data from systems operators is heterogeneous and requires extensive hand-cleaning. The monthly data is often provided via a .txt file in 15-min trading blocks. For consistency, this section focuses on the automatic Frequency Restoration Reserve (aFFR) prices for providing frequency up (a balancing problem historically solved by generating more electricity). This is the equivalent of solving the problem displayed in FIG. 4 when wind/solar does not generate as much energy as planned. aFFR relates to the management and balancing of electrical grids.
FRRs are crucial to maintain the stability and reliability of power systems. They are used to continuously balance the electricity supply and demand, ensuring the power system's frequency remains within operational limits. FRR is essential in power systems because electricity cannot be stored easily in large quantities, so production and consumption must be balanced in real time. aFFR refers to the automatic part of FRR, which is activated without manual intervention to restore the system frequency to its nominal value following a deviation. This can be due to sudden changes in demand or supply, such as the unexpected loss of a large power plant or a significant load block.
By providing a rapid response to frequency deviations, aFFR helps maintain the stability of the power system, ensuring a reliable supply of electricity and preventing potential power outages or grid failures. This is a critical component of grid balancing activities, especially in grids with a high penetration of variable renewable energy sources, such as wind and solar power, which can introduce significant fluctuations in power supply.
TABLE 1 shows the summary statistics. Balancing costs are presented in U.S. dollars; the average observation is $122.57/MWh. The average % of renewable generation is 21.40% and ranges from 4%–46%.
Given that the balancing cost is an average across five countries, the individual country breakout is present in TABLE 2. Note that Sweden has a large amount of hydropower, which is used for balancing, lowering its balancing costs well below the sample average. As of 2023, Poland has a large amount of coal generation, reducing balancing costs. Therefore, all multivariate models use country-fixed effects based on the country-level dispersion. Texas is the closest U.S. parallel to the European market-based system, which reflects much lower balancing costs of between $18/MWh and $38/MWh. This reflects the lower penetration of wind/solar in Texas, its plentiful gas supplies and the slower phase-out of fossil fuel generation.
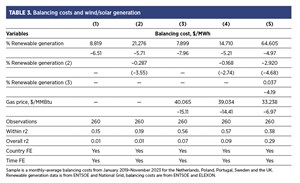
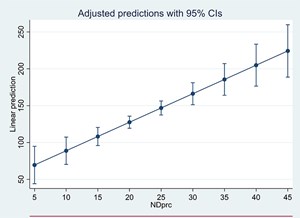
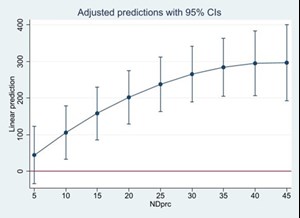
TABLE 3 presents multivariate regressions with both country and year-month fixed effects. Models 1 and 3 present the direct impact of wind/solar on balancing costs, with Model 3 controlling for gas prices. Both models document a significantly positive relation between the % of renewable generation and balancing costs. In Model 3, gas prices and balancing costs are documented, which is intuitive given that most markets use gas generators to balance the grid. FIG. 7 documents the linear relation predicted by Model 3 in TABLE 3.
The linear model generally accurately predicts the relationship between wind/solar penetration and balancing costs observed in the data. However, the nonlinear aspect of the electricity supply curve (as presented using real-life data in FIG. 5) suggests a potential escalating level of balancing costs as the % of renewable generation increases. To test this nonlinear hypothesis, Model 4 includes a squared term. Surprisingly, this term is negative, implying that the balancing costs flatten out as renewables penetration increases. This is similar to the empirical finding on U.S. data with ACE as a function of wind generation documented by Godwin and Oliver, who posit diversification effects and economies of scale (FIG. 8).14
However, this type of flattening runs counter to the documented non-linearity of the supply curve and anecdotal evidence from systems operators, such as that documented using National Grid data in FIG. 6. In the final model, a cubed term is added to test for an S-curve in the balancing costs. This allows for the flattening observed in Godwin and Oliver while also accounting for the extreme prices at the right side of the supply curve.14 A significantly positive coefficient is observed, signaling a right upward hook in prices as renewable generation increases (FIG. 9).
Policy implications. It is unlikely that the predicted value in Model 5 of $3,000 of balancing costs at the IEA's target of 70% wind/solar will arrive in reality. Either wind and solar will prove politically impossible and will be abandoned, or new, more efficient technology will arrive to replace fossil fuels in the balancing mechanism. Along those lines, the question remains whether battery storage can replace fossil fuels as a flexible deployment tool. The IEA's roadmap estimates that 3,500 GW of newly installed battery capacity will be necessary to replace fossil fuels-based generation by 2050.15
There is 2 GW of installed battery capacity in the UK, and there was roughly 25 GW installed globally in 2022.16,17 Even accounting for technological changes, production must rapidly increase to come anywhere close to batteries becoming a major player. There are practical problems, as well. If end-of-life costs are included, the LCOE of batteries can be quite high.18
Additionally, current battery farms appear to have installed capacities of roughly 10 acres per MW. Using current technology, this requires battery farms of 35 MM acres to provide a capacity of 3,500 GW, which would be a battery farm roughly the size of England. In short, batteries have numerous technological obstacles to overcome before replacing fossil fuel generators in balancing markets.
The author acknowledges that California is often cited as a successful example of using a major rollout of battery farms to provide frequency response services.19 In Model 5 of TABLE 3 and anecdotally from European systems operators, the 30%–35% wind/solar penetration is where significant problems arise. California's generation stack is roughly 27% wind/solar and, therefore, has not yet reached the wind/solar penetration level predicted to cause severe grid balancing problems. It is, therefore, too premature to suggest that batteries have solved all of California's grid balancing needs.
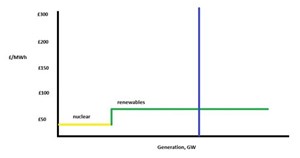
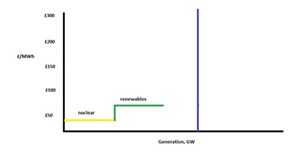
A net-zero generation stack. A carbon-neutral world envisions a situation where renewable sources—and potentially nuclear—can provide energy. What does that economic model look like? FIG. 10 describes the microeconomics of this model.
In practice, this looks appealing. However, wind generation is correlated among wind turbines, and solar generation is correlated among solar panels, at least regionally. In these cases, more capacity simply increases the volatility of realized generation and not the actual capacity. Therefore, one risk is ending up with a "hole" in the generation stack/supply curve, as in FIG. 11, resulting in blackouts. Too much wind results in curtailment exercises or negative spot prices.
Such a generation stack practically guarantees situations where too much or too little is generated. As noted above, batteries are unlikely to solve this problem completely. Rather, inexpensive grid technologies that innovatively balance load imbalances will likely play a vital role in any carbon-neutral future.
Takeaways. The transition to intermittent renewable energy sources (wind and solar) is crucial for sustainable power systems but presents significant challenges, notably regarding electricity balancing costs. This article has delved into the empirical evidence from the UK and several European markets, showcasing a pronounced increase in these costs with greater renewable penetration. Notably, the data reveal a nonlinear escalation of balancing costs, with projections hitting nearly $1,000/MWh at the 70% wind/solar threshold suggested by the IEA's net-zero forecast.15 Such findings highlight the economic and operational complexities of renewables' variability and unpredictability.
The empirical insights extend beyond the rising costs, touching on the mechanisms through which these costs are distributed among market participants. This distribution impacts generators, retailers and consumers, influencing their operational strategies and financial planning. The article has assessed the adequacy of current balancing mechanisms and system operator strategies in the face of increasing renewables, suggesting that while these approaches have been instrumental, they may not be thoroughly equipped for the future grid's demands.
Furthermore, the article has evaluated the potential of flexible and distributed energy resources as policy solutions for managing imbalances more effectively. Although the empirical analysis suggests that the impact of these technologies on balancing costs is limited, it also points to the significant potential for technological advancements to enhance their role in future energy systems.
In essence, this article strikes a balance between highlighting the empirical findings on rising electricity balancing costs due to renewable integration and exploring the implications of these findings for policy and system operation. It underscores the need for ongoing innovation, collaboration and policy development to address the challenges of balancing costs in an era increasingly dominated by renewable energy sources. The evidence presented serves as a call to action for market participants, system operators and policymakers to work together in crafting sustainable, efficient and forward-looking solutions for electricity balancing in renewable-rich power systems.
LITERATURE CITED
1 Joskow, P., “Challenges for wholesale electricity markets with intermittent renewable generation at scale: The US experience,” Oxford Review of Economic Policy, 2019.
2 Godoy-Gonzalez, D., E. Gil, G. Gutierrez-Alcaraz, et al., “Ramping ancillary service for cost-based electricity markets with high penetration of variable renewable energy,” Energy Economics, 2020.
3 Katzenstein, W., J. Apt, et al., “The cost of wind power variability,” Energy Policy, 2012.
4 IEEE, et al., Kiviluoma, J., P. Meibom, A. Tuohy, N. Troy, M. Milligan, B. Lange, M. Gibescu and M. O’Malley, “Short-term energy balancing with increasing levels of wind energy,” 2012.
5 Østergaard, P., “Ancillary services and the integration of substantial quantities of wind power,” Applied Energy, 2006.
6 Renewable and Sustainable Energy Reviews, Singarao, V. and V. Rao, et al., “Frequency responsive services by wind generation resources in United States,” Renewable and Sustainable Energy Reviews, 2016.
7 Vandezande, L., L. Meeus, R. Belmans, M. Saguan and J. M. Glachant, et al., “Well-functioning balancing markets: A prerequisite for wind power integration,” Energy Policy, 2010.
8 Seel, J., D. Millstein, A. Mills, M. Bolinger and R. Wiser, et al., “Plentiful electricity turns wholesale prices negative,” Advances in Applied Energy, 2021.
9 Woo, C.-K., I. Horowitz, J. Moore and A. Pacheco, et al., “The impact of wind generation on the electricity spot-market price level and variance: The Texas experience,” 9 Energy Policy, 2011.
10 Brouwer, A. S., M. van den Broek, A. Seebregts and A. Faaij, et al., “Impacts of large-scale intermittent renewable energy sources on electricity systems, and how these can be modeled,” Renewable and Sustainable Energy Reviews, 2014.
11 Liebensteiner, M. and M. Wrienz, et al., “Do intermittent renewables threaten the electricity supply security?” Energy Economics, 2020.
12 Skea, J., D. Anderson, T. Green, R. Gross, P. Heptonstall and M. Leach, et al., “Intermittent renewable generation and the cost of maintaining power system reliability,” IET Generation, Transmission & Distribution, 2008.
13 Buschbaum, J., C. Hausman, J. Mathieu and J. Peng, et al., “Spillovers from ancillary services to wholesale energy markets,” RAND Journal of Economics, 2024.
14 Godwin, V. and Oliver, M., et al., “Wind intermittency and supply-demand imbalance: Evidence from U.S. regional power markets,” Georgia Institute of Technology, 2023.
15 IEA, “Net zero by 2050,” May 2021, online: https://www.iea.org/reports/net-zero-by-2050
16 Rystad Energy, et al., Pratheeksha, R. and Busby, E., “Charging Up: UK utility-scale battery storage to surge by 2030, attracting investments of up to $20 billion,” 2023.
17 Rystad Energy, et al., Soltani, S. and Skaug, L., “New battery storage capacity to surpass 400 GWh per year by 2030 – 10 times current additions,” 2023.
18 Xu, Y., J. Pei, L, Cui, P., Liu, T. Ma, et al., “The levelized Cost of Storage of Electrochemical Energy Storage Technologies in China,” Frontiers of Energy Research, 2022.
19 Caiso, “Special report on battery storage,” July 2023, online: https://www.caiso.com/Documents/2022-Special-Report-on-Battery-Storage-Jul-7-2023.pdf

